![]()
|
|
This note tells you what to do when you have finished drawing a graph. (You might also like to have a look at More advanced graph-plotting.)
Use these diagrams and the descriptions in pink to identify the general shape of the graph
| 1 |
|
A straight line passing through the origin |
|
|
y is directly proportional to x |
|||
|
y = m x |
|||
|
|
|||
| 2 | 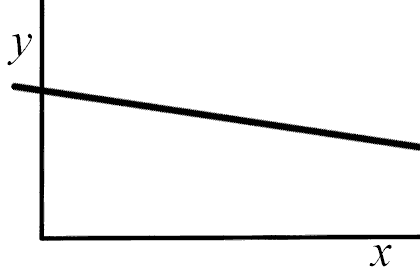 |
A straight line not passing through the origin |
|
|
y varies linearly with x |
|||
|
Find the gradient and the y-intercept |
|||
|
y = m x + c |
|||
|
|
|||
| 3 | 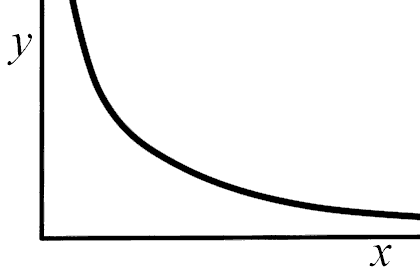 |
A curve touching neither axis |
|
|
y might be inversely proportional to x |
|||
|
Look for a constant product yx |
|||
|
y x = constant |
|||
|
|
|||
| 4 | 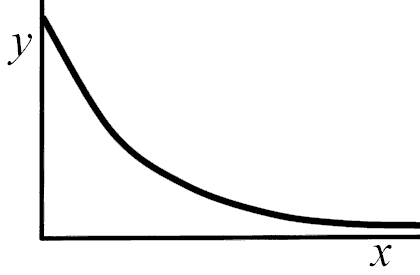 |
A curve touching the vertical axis but not touching the horizontal axis |
|
|
y might vary exponentially with x |
|||
|
y = e -kx where k = ln2/x½ |
|||
|
|
|||
|
5 |
None of these |
||
|
You could well be reduced to saying "y increases/decreases in a complicated way with x". |
|||
|
Click here for hints on coping with non-standard graphs. |
|||
In the case of types 1 and 2 you may draw the conclusion indicated in mauve at once with no further ado, substituting the names of the actual quantities plotted vertically and horizontally for the y and x given here.
In the case of types 3 and 4 you must carry out the test indicated in blue first. If it is confirmed, then you may draw the conclusion indicated in mauve, substituting the names of the actual quantities plotted vertically and horizontally for the y and x given here and removing the 'might'.
It is often the case that the gradient and/or the y-intercept have a physical significance. You should identify this if you can.
(The equation given for type 4 is for men in Senior Part and VI Book only!)
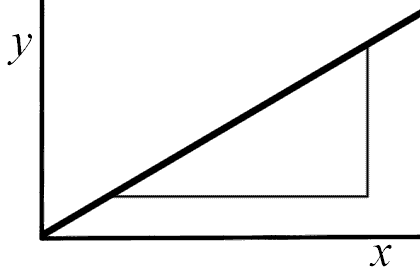 |
1. Draw a 'gradient triangle', using at least half of your best-fit straight line. 2. Find the height of the triangle using not a ruler but the vertical graph scale. 3. Find the base of the triangle, using not a ruler but the horizontal graph scale. 4. The gradient is the fraction (scaled height / scaled base). |
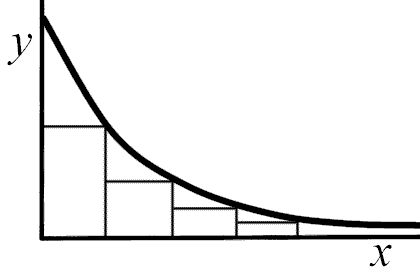 |
1. Choose an arbitrary point on the line and drop a vertical to the horizontal axis. The vertical axis itself is often a good choice. 2. Locate the point half way down this vertical, 3. Draw a horizontal from the mid-point of the vertical until it reaches the graph. 4. Draw a new vertical from this position and find its mid-point. 5. Draw another horizontal, and keep repeating the process. 6. If (and only if) the bases of the step pattern produced are all the same (within acceptable limits), then the base of each step is the half-life, and the graph qualifies as exponential. |
Tony Ayres, March 2001